
The higher the resolution, the more detail you can see; it is obvious that 4k is better than 720p.
Let’s use the data resolution on the example of the administrative department in Power BI. The best way to present this type of data is to use a Filled map. As an example I will use Poland, which is more complicated than the USA and we can learn a lot from it.
In Poland we have sixteen voivodeships (województwo), which are equivalent to states in the US. Each voivodeship is subdivided into counties (powiat) and each county is subdivided into municipalities (gmina).
Voivodeship level
Let’s try to create a map on a voivodship level. I use a simple table, nothing fancy.
| Id | voivodeship PL |
| 1 | dolnośląskie |
| 2 | kujawsko-pomorskie |
| 3 | lubelskie |
| 4 | lubuskie |
| 5 | łódzkie |
| 6 | małopolskie |
| 7 | mazowieckie |
| 8 | opolskie |
| 9 | podkarpackie |
| 10 | podlaskie |
| 11 | pomorskie |
| 12 | śląskie |
| 13 | świętokrzyskie |
| 14 | warmińsko-mazurskie |
| 15 | wielkopolskie |
| 16 | zachodniopomorskie |
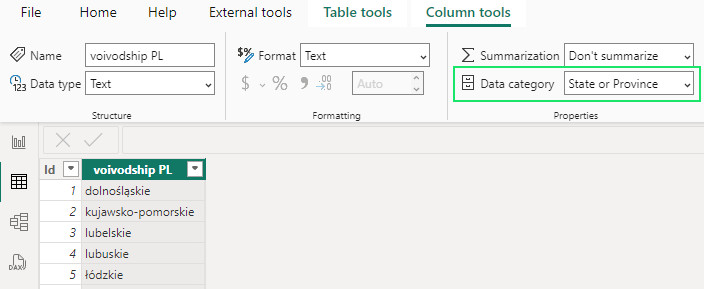
Also remember to set in the Table view in Column tools correct Data category for voivodship column. It should be set to State or province.
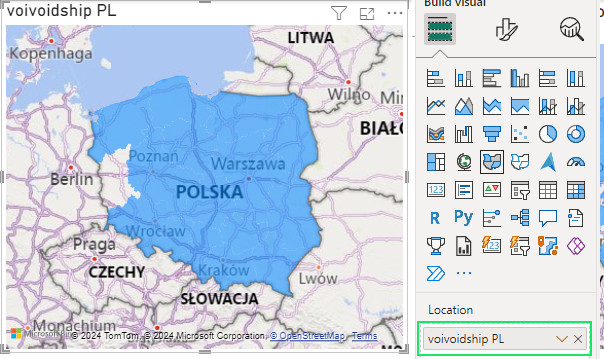
The data is ready. I put it on the filled map and done. Wait… lubuskie voivodeship is missing!
Without going into details, one of the sources of Power BI geographical data is Wikipedia and it is not the Polish one. To fix this, I had to translate the names into English according to Wikipedia and also add the keyword „voivodeship”.
| Id | voivodship EN |
| 1 | Lower Silesian Voivodeship |
| 2 | Kuyavian-Pomeranian Voivodeship |
| 3 | Lublin Voivodeship |
| 4 | Lubusz Voivodeship |
| 5 | Łódź Voivodeship |
| 6 | Lesser Poland Voivodeship |
| 7 | Masovian Voivodeship |
| 8 | Opole Voivodeship |
| 9 | Subcarpathian Voivodeship |
| 10 | Podlaskie Voivodeship |
| 11 | Pomeranian Voivodeship |
| 12 | Silesian Voivodeship |
| 13 | Holy Cross Voivodeship |
| 14 | Warmian-Masurian Voivodeship |
| 15 | Greater Poland Voivodeship |
| 16 | West Pomeranian Voivodeship |
We are ready for take-off! It is now possible to project data at voivodeship level. No white spots, nice blue colour from the mountains to the sea.
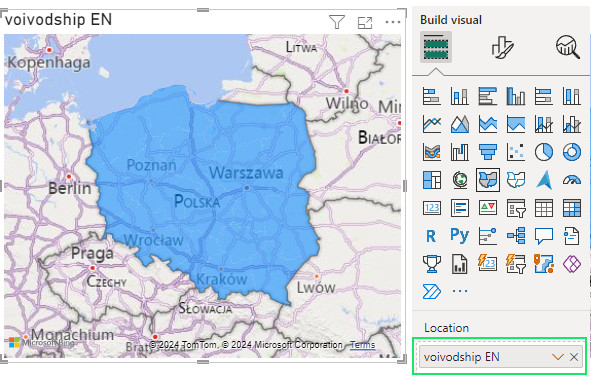
Let us put some data on this map to make sure that the voivodship borders are good.

County level
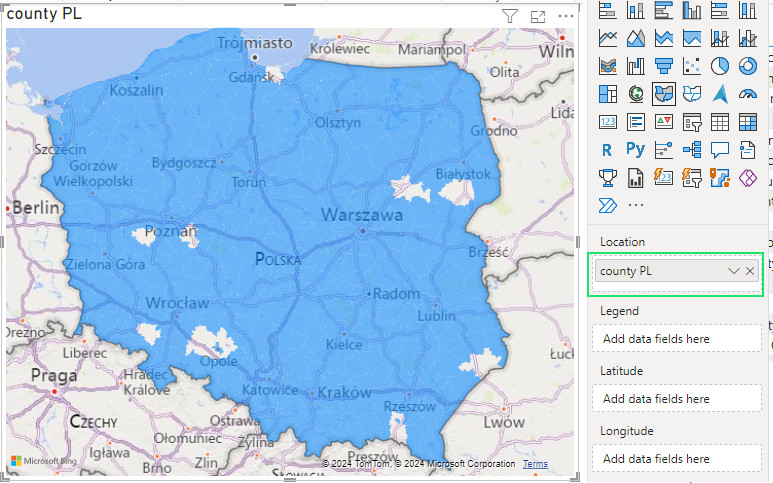
There are 380 counties in Poland. We can predict (as predictive data scientists) that it will be more complicated to have them on the map. County names are similar to city names and we don’t need this confusion. So I had to add the keyword „county”, which is „powiat” in Polish, to each name. We will use the table with Polish county names extended by the keyword „powiat”.
| Id | county PL |
| 1 | powiat Biała Podlaska |
| 2 | powiat Białystok |
| 3 | powiat Bielsko-Biała |
| (…) | (…) |
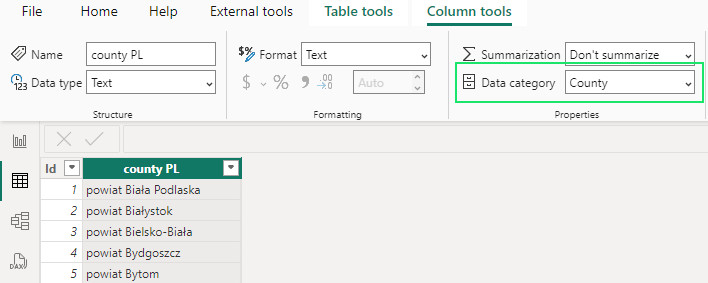
The Data category for county column should be set to the County (Table view->Column tools).
As expected predicted, I also got some white spots. We had this issue with the voivodeships and obviously we have it here.
Before I do the trick with the translation into English, let’s try to use the „helper” fields of Latitude and Longitude that are available for Fill Map. The data for these fields has been created on the basis of the centroid of each county. The data category is set to Latitude and Longitude accordingly.
| Id | county PL | Centroid longitude | Centroid latitude |
| 1 | powiat Biała Podlaska | 23,14201903 | 52,03000645 |
| 2 | powiat Białystok | 23,15881458 | 53,13221982 |
| 3 | powiat Bielsko-Biała | 19,03890219 | 49,81297875 |
| (…) | (…) | (…) | (…) |
The result is both interesting and disappointing. I get rid of some of the white spots, but I get new ones. There are also some areas marked in darker blue, indicating duplicates. Power BI interpreted two counties as the same county and overlaid the data.

Using centroids is not much help to us and we can get rid of it. Unfortunately, to fill in the white spots, we need to have a deeper knowledge of counties and trick Power BI with English keywords. We have two major issues that create white spots.
- We have counties and cities with county status. Here is an example
- powiat nowosądecki – regular county
- powiat Nowy Sącz – city with county status
- We have different counties with the same name. There are 7 of them in Poland, for example.
- powiat Brzeski in Lesser Poland Voivodeship
- powiat Brzeski in Opole Voivodeship
To fix this, we need to use English again and pay particular attention to these two issues
- Cities with county status need to be described more explicitly using the keywords „city county”.
- nowosądecki county – regular county
- Nowy Sącz city county – city with county status
- For different counties with the same name it is better to use the city name which is based on the county name plus the keyword „county”.
- Brzesko County (powiat Brzeski in the voivodship of Lesser Poland)
- Brzeg County (powiat Brzeski in voivodship Opole).
Of course, you don’t have to do this all by yourself, here is a link to the csv file with the working translation of the Polish counties (Polish counties (powiaty) PL and EN for Power BI Fill map). Now the table of counties looks like this.
| Id | county EN |
| 1 | Biała Podlaska city county |
| 2 | Białystok city county |
| 3 | Bielsko-Biała city county |
| (…) | (…) |
And the desired result is as follows

If we put some data on this map, we will get a nice mosaic showing 24 times more details compared to the voivodeship map.

In the world of graphics, below you can see the difference between data resolution at voivodeship level (16 px) and at county level (rounded up to 400 px).
There is a huge difference in quality, so don’t be afraid to get more detail from your data.
Advantages of this approach:
- Relatively easy to implement
Disadvantages of this approach:
- You can never be sure that today’s naming of provinces and districts will be correct in the future. There is no „official Power BI naming list of Polish voivodships and counties”.
- If you want to get a more detailed map (each voivodeship is made up of municipalities), you can’t do that with the shape map.